What is a Bullish Harami Pattern?
A bullish harami is a two-candle candlestick pattern that indicates a potential reversal in a downtrend. It is formed by a large black candle (the first candle) followed by a small white candle (the second candle) that is completely engulfed by the black candle. The bullish harami pattern is often seen as a sign of weakness in the downtrend and can be used to signal a potential buying opportunity.
How to Identify a Bullish Harami Pattern?
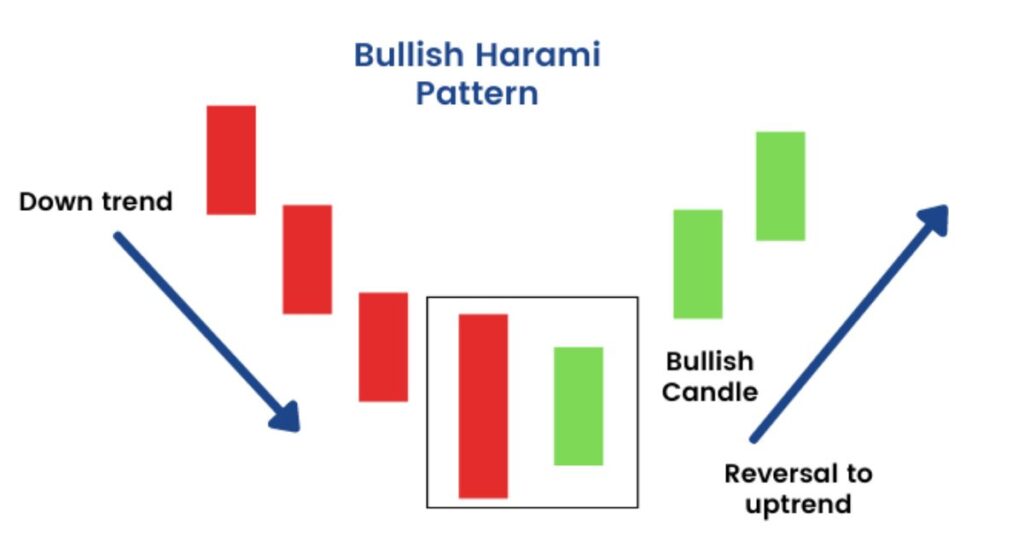
There are three key characteristics of a bullish harami pattern:
-
The first candle is a large black candle with a long body and short wicks.
-
The second candle is a small white candle with a body that is completely engulfed by the black candle.
-
The second candle opens above the midpoint of the black candle.
The Psychology Behind the Bullish Harami Pattern
The bullish harami pattern is thought to be a sign of a reversal in a downtrend because it indicates that the bears are losing momentum. The large black candle represents the continuation of the downtrend, but the small white candle shows that the bulls are starting to push back. The fact that the white candle is completely engulfed by the black candle suggests that the bulls are still not strong enough to take control of the market, but they are making progress.
How to Trade the Bullish Harami Pattern
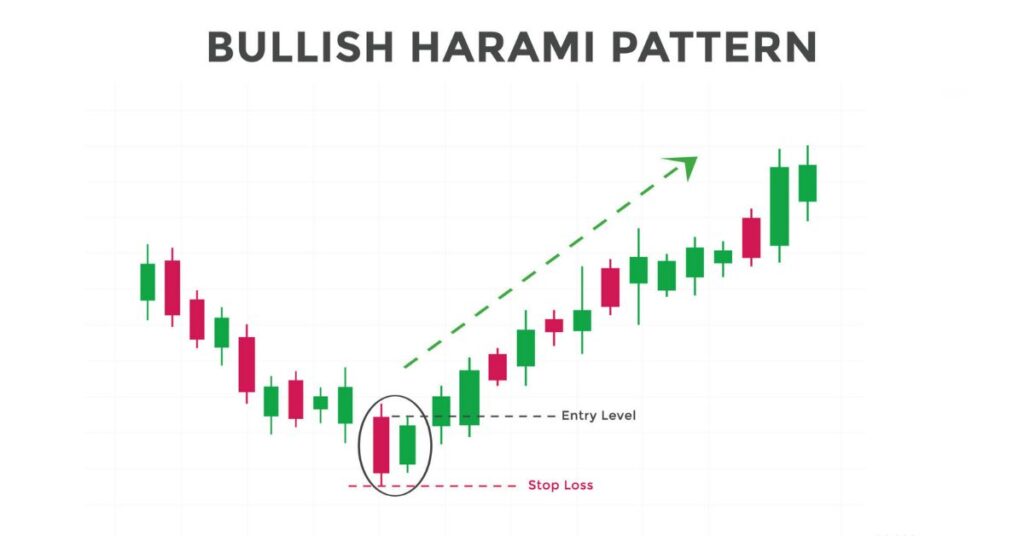
There are a few different ways to trade the bullish harami pattern. One common approach is to wait for the second candle to close and then enter a long position if the price closes above the high of the second candle. Another approach is to use the pattern as a confirmation of a breakout from a support level.
It is important to note that the bullish harami pattern is not a foolproof indicator and should be used in conjunction with other technical analysis tools.
Here are some additional things to keep in mind when trading the bullish harami pattern:
- The pattern is more reliable when it occurs at a support level.
- The pattern is more significant if the second candle is a doji.
- The pattern is less reliable if the second candle is a spinning top.
Overall, the bullish harami pattern is a valuable tool that can be used to identify potential reversals in downtrends. However, it is important to use the pattern in conjunction with other technical analysis tools and to be aware of its limitations.