 Chart patterns are an essential part of technical analysis, helping traders identify trading opportunities and develop winning trading strategies. These visual formations, which repeatedly appear on trading charts, can be used to enter and exit trades with a high probability of success, especially when combined with risk management tools.
However, there are many different chart patterns, and memorizing them all can be daunting. Additionally, chart patterns can be bullish, bearish, or indicate a trend reversal, continuation, or ranging mode.
Whether you’re a beginner or an experienced trader, a comprehensive PDF guide to chart patterns is a valuable resource. Such a guide would provide a one-stop shop for learning about all the chart patterns you need to know, with clear explanations and examples.
In summary, chart patterns are a powerful tool for technical traders, but there are many different patterns to learn and remember. A comprehensive PDF guide to chart patterns can be a valuable resource for traders of all experience levels.
So, if you are looking for a chart patterns cheat sheet to use when trading, then you’ve come to the right place!
Chart Patterns Cheat Sheet Download (PDF File)
Here is a cheat sheet of the most popular and widely used trading patterns. You can print it out and stick it on your desk, or save it in a folder for easy access.
This cheat sheet will help you to identify and understand these patterns so that you can use them to make better trading decisions.
I hope this Chart Pattern Cheat Sheet will be helpful!
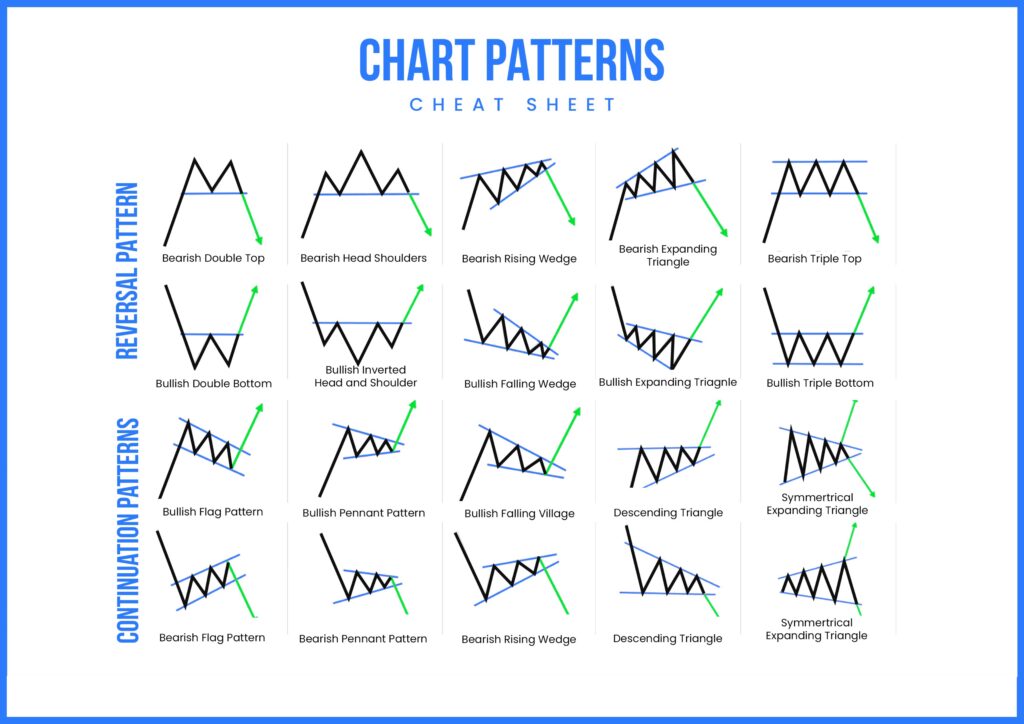
Chart Patterns Cheat Sheet Free Download
Why Do You Need a Chart Pattern Cheat Sheet?
Chart patterns cheat sheets are an essential tool for traders who want to make informed trading decisions by identifying recurring patterns in the market. All types of traders use chart patterns to determine when to enter or exit trades, and many believe that chart analysis is one of the most effective ways to trade financial instruments. Basically, chart patterns allow you to use past market data to predict future price movements.
Some basic chart patterns are easy to spot, such as the Doji candlestick pattern but you might need a cheat sheet to remember the chart formations of other famous Doji candle patterns like the Dragonfly, Gravestone, or the long-legged. However, other chart patterns, such as harmonic crab patterns, can be more complex to identify and remember. A chart patterns cheat sheet can be helpful for both beginners and experienced traders, as it can provide a quick reference guide to the most common and effective chart patterns.
Similar to a trading plan template, a chart patterns cheat sheet can help you simplify your trading process. Many professional traders who work for proprietary trading firms are advised to use notes and printable sheets to help them remember key information and make better trading decisions.
Overall, chart patterns cheat sheets are a valuable tool for traders of all levels of experience. They can help you to identify potential trading opportunities and make more informed trading decisions.
3 Types of Chart Patterns
Chart trading patterns can be broadly divided into two categories: bullish and bearish.
- Bullish chart patterns signal the end of a downtrend and the start of a new uptrend.
- Bearish chart patterns suggest that an uptrend is losing momentum and a downtrend is impending.
In other words, bullish chart patterns suggest that it is time to buy, while bearish chart patterns suggest that it is time to sell.
1. Reversal Patterns
Reversal chart patterns are formations that signal a change in trend direction, from bearish to bullish or vice versa. They appear before a new trend begins and indicate that the price action is likely to move in the opposite direction. Traders use reversal chart patterns to identify the end of a trend and the beginning of a new opposite trend.
Let’s Put in another way:
Reversal chart patterns are signals that the market is about to change direction. They appear before the new trend begins, so traders can use them to identify the end of one trend and the start of another.
2. Continuation Patterns
Sure, here is a rewritten version of your paragraph with the same meaning:
Continuation patterns are chart patterns that suggest the current trend is likely to continue after a brief pause. Traders use these patterns to identify potential entry points and join the existing trend.
In contrast to trend reversal patterns, continuation patterns do not indicate that the trend is about to change direction. Instead, they suggest that the trend is taking a break before resuming its previous course.
Here are some common examples of continuation patterns:
- Triangles
- Flags
- Pennants
- Rectangles
Once a continuation pattern has been completed, traders can look for a breakout in the direction of the trend. If the breakout occurs, traders may enter a long trade (if the trend is up) or a short trade (if the trend is down).
3. Bilateral Patterns
Bilateral chart patterns are a type of pattern that can indicate either a reversal or continuation of the current trend. They form when buyers and sellers are indecisive, and the price is in equilibrium.
Traders can use bilateral chart patterns to trade inside a predefined range, using support and resistance levels or the supply and demand strategy. This involves buying the asset when it reaches support and selling when it reaches resistance.
When the price breaks above or below the support or resistance level, it signals a breakout. Traders can then switch to a breakout trading strategy and enter a trade in the direction of the breakout.
In a simple way we can understand that :
Bilateral chart patterns show that buyers and sellers are undecided. Traders can use these patterns to trade inside a range or to enter a trade in the direction of a breakout.
Conclusion
Chart patterns are a powerful tool for traders to understand market sentiment and predict future price movements. By mastering chart patterns, traders can become more successful in their trading journey.
Chart patterns are recurring patterns in price movements that can be used to identify potential trading opportunities. There are many different types of chart patterns, each with its own unique characteristics. Some chart patterns are reversal patterns, which signal that the current trend is about to change direction. Other chart patterns are continuation patterns, which signal that the current trend is likely to continue.
Chart patterns can be difficult to remember, especially for new traders. A Chart patterns cheat sheet can be used to identify potential trading opportunities, understand market sentiment, and predict future price movements.
It is important to note that no chart pattern is guaranteed to be successful and they should not be used in isolation when making trading decisions. Other factors such as technical indicators and fundamental analysis should also be considered.