What is a Hammer Candlestick Pattern?
A hammer candlestick pattern is a bullish reversal candlestick pattern that appears on price charts of financial instruments like stocks, forex, and futures. It signals a potential reversal of a downtrend and the possibility of an upcoming uptrend.
Key Characteristics of a Hammer Candlestick Pattern:
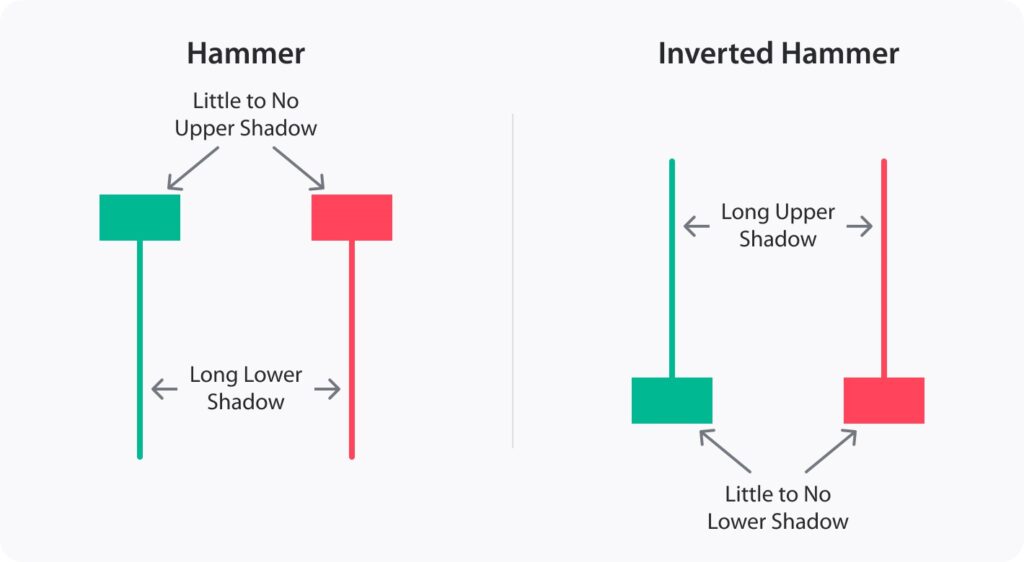
- Small real body: The real body of the hammer candlestick is relatively small compared to the overall length of the candlestick. This indicates that the opening and closing prices are close to each other.
- Long lower wick: The lower wick of the hammer candlestick is at least twice the length of the real body. This long wick signifies that the price dropped significantly below the opening price during the trading session but was bought back up later in the day.
- Little or no upper wick: The upper wick of the hammer candlestick is either very small or non-existent. This indicates that there was little to no selling pressure after the price reached its high point for the day.
Formation and Interpretation of Hammer Candlestick Pattern:
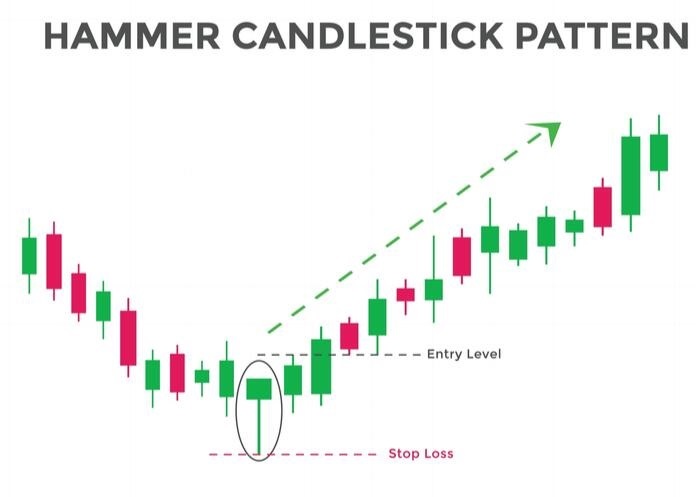
The hammer candlestick pattern typically forms at the bottom of a downtrend. The long lower wick indicates that sellers were aggressive early in the trading session and pushed the price down significantly. However, buyers stepped in later in the day and drove the price back up, resulting in a close near the opening price. This suggests that the selling pressure is weakening and that a potential trend reversal might be underway.
Trading with Hammer Candlestick Pattern:
The hammer candlestick pattern is not a guaranteed signal of a trend reversal. It should be used in conjunction with other technical indicators and chart analysis to confirm the signal. Some additional factors to consider when trading with the hammer pattern include:
- Volume: Higher trading volume on the hammer candlestick day strengthens the reversal signal.
- Confirmation candlestick: A bullish candlestick following the hammer candlestick pattern provides further confirmation of the reversal.
- Support and resistance levels: The hammer pattern is more likely to be reliable if it forms near a support level.
Limitations of Hammer Candlestick Pattern:
It is important to remember that the hammer candlestick pattern is just one technical indicator and should not be used as the sole basis for trading decisions. Some of the limitations of the hammer pattern include:
- False signals: The hammer pattern can sometimes generate false signals, especially if it is not confirmed by other technical indicators.
- Subjectivity: The interpretation of the hammer pattern can be subjective and may vary from trader to trader.
- Market context: The reliability of the hammer pattern can be affected by the overall market context and sentiment.
Additional Resources:-
Tradingguider: https://www.tradingguider.com/hammer-candle-pattern-in-hindi
Investopedia: https://www.investopedia.com/terms/h/hammer.asp
I hope this information is helpful. Please let me know if you have any other questions.