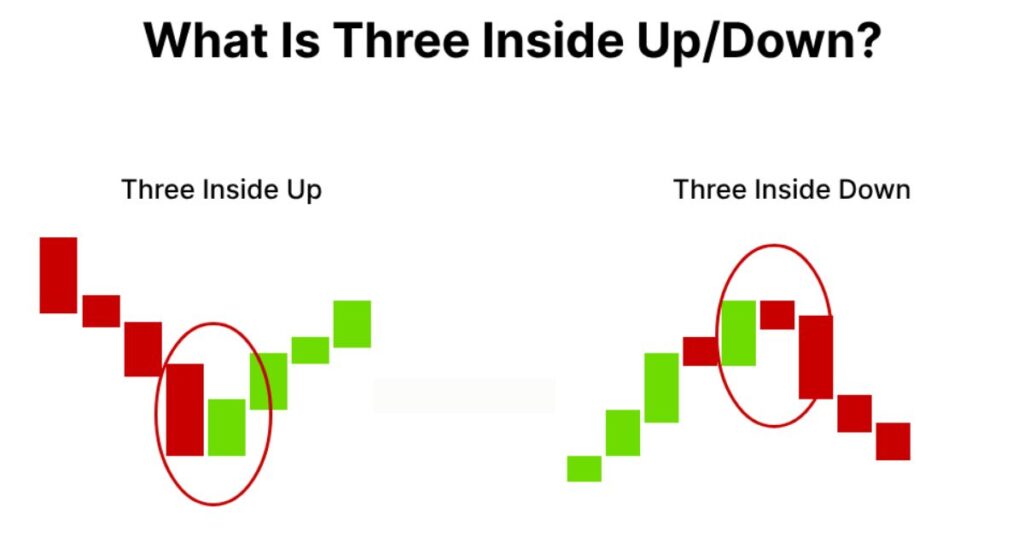
The Three Inside Up pattern is a bullish reversal candlestick pattern that indicates a potential change in trend from downward to upward. It is formed by three consecutive candlesticks:
-
The first candle is a long black candle, indicating a continuation of the downtrend.
-
The second candle is a smaller green candle that is entirely contained within the body of the first candle. This suggests that the selling pressure has started to weaken.
-
The third candle is a green candle that engulfs the bodies of both the first and second candles. This confirms the reversal and signals that the bulls are now in control.
Formation
Interpretation
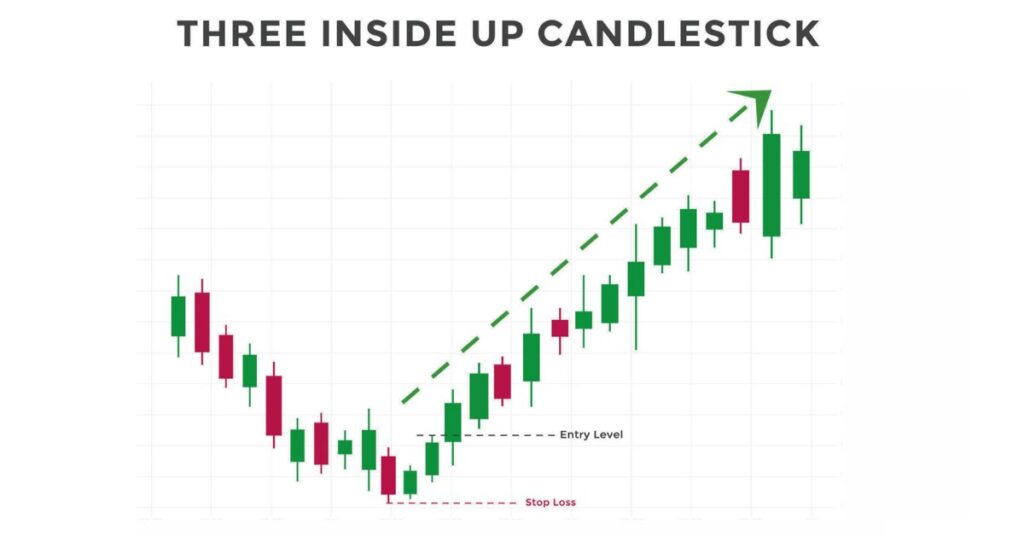
The Three Inside Up pattern is a reliable indicator of a potential bullish reversal, especially when it occurs after a period of strong selling pressure. The pattern suggests that the bears are losing momentum and that the bulls are ready to take control.
Trading Implications
Traders can use the Three Inside Up pattern to generate trading signals. A buy signal is generated when the third candle closes above the high of the first candle. Alternatively, a stop-loss order can be placed below the low of the second candle to limit risk.
Confirmation
The Three Inside Up pattern is more reliable when it is confirmed by other technical indicators, such as a bullish crossover on the moving average convergence divergence (MACD) indicator or a break above a key resistance level.
Limitations
The Three Inside Up pattern is a short-term reversal pattern and may not always lead to a significant or even minor trend change. It is important to use the pattern in conjunction with other technical indicators and to always practice risk management.
Additional Notes
-
The Three Inside Up pattern is similar to the Bullish Harami pattern, but it is considered to be a stronger reversal signal.
-
The Three Inside Up pattern can also be used to identify potential support levels.
-
The Three Inside Up pattern is a versatile pattern that can be used on a variety of timeframes, from intraday to monthly charts.
I hope this information is helpful. Please let me know if you have any other questions.