The Tweezer Top candlestick pattern is a bearish reversal pattern that signals the potential end of an uptrend. It consists of two candlesticks with the same high, forming a “tweezers” shape. The first candle is a bullish candlestick, and the second is a bearish candlestick with a long upper shadow.
Image of Tweezer Top Candlestick Pattern:
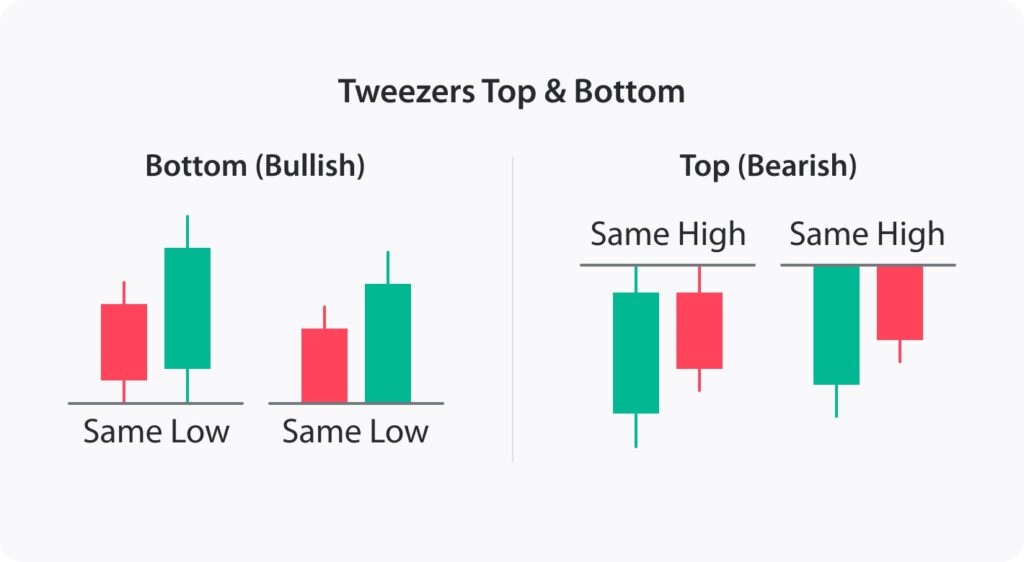
Formation:
- Uptrend: The pattern forms at the top of an existing uptrend.
- Bullish Candle: The first candlestick is a bullish candle, indicating continued buying pressure.
- Bearish Candle: The second candlestick is a bearish candle with a long upper shadow. This suggests that sellers rejected the higher prices and pushed the price back down.
- Equal Highs: The high of both candlesticks is the same, forming the “tweezers” shape.
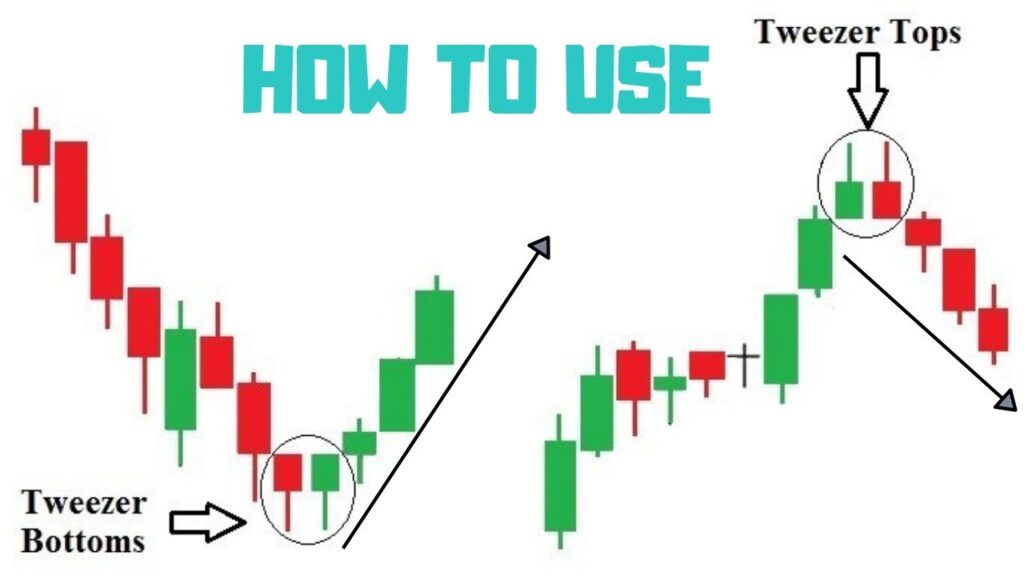
Trading Signals:
The Tweezer Top pattern is a signal that the uptrend may be ending and a potential price reversal is coming. It is a strong bearish reversal pattern, especially when confirmed by other technical indicators.
Confirmation:
- Volume: The volume on the second candlestick should be higher than the volume on the first candlestick. This confirms the selling pressure and increasing bearish sentiment.
- Technical Indicators: Other technical indicators, such as moving averages or oscillators, can be used to confirm the downward trend and potential reversal.
Trading Strategies:
- Short sell: Traders can enter a short sell position after the second candlestick closes below the high of the first candlestick.
- Stop-loss: The stop-loss order should be placed above the high of the second candlestick.
- Exit: Traders can exit the trade when the price breaks below a support level or when another technical indicator signals a reversal.
Psychology:
The Tweezer Top pattern reflects a shift in market psychology. After a period of bullishness, sellers become more active and push the price back down. This can be due to a variety of factors, such as profit-taking, overvaluation of the asset, or negative news.
Limitations:
The Tweezer Top pattern is not always accurate and should not be used as the sole basis for trading decisions. It is important to consider other technical indicators and market conditions before making any trades.
Additional Notes:
- The reliability of the Tweezer Top pattern increases with higher timeframes.
- The pattern is more significant when it occurs at a resistance level.
- Traders should be aware of false signals and use other confirmation methods to improve their trading results.
I hope this information is helpful. Please let me know if you have any other questions.